gitpulse
Turn any git repo’s history into a single-file HTML analysis report.
gitpulse 是一個命令列小工具:指向任何一個 git 專案,它會讀完整段 commit 歷史,產生一份單一 HTML 檔的分析報告。圖表全部是用 Python 自己畫的內嵌 SVG,不需要網路、不用任何 JavaScript 圖表函式庫,整個專案零第三方依賴(只用 Python 標準函式庫和你電腦上的 git)。
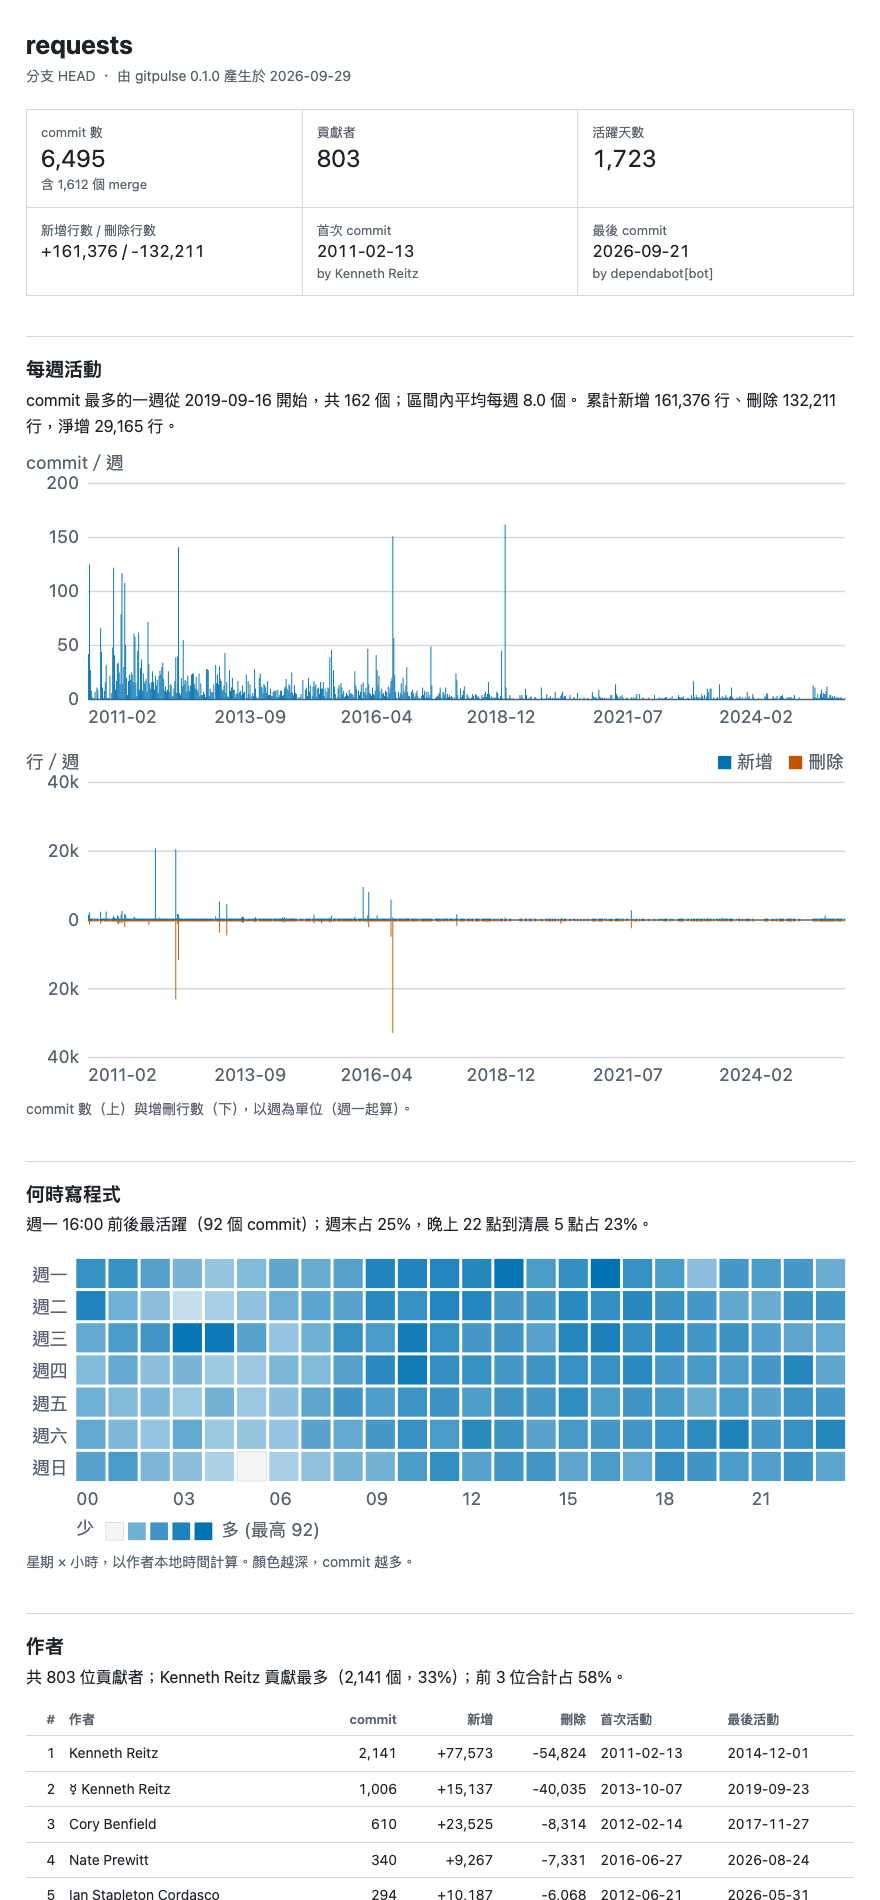
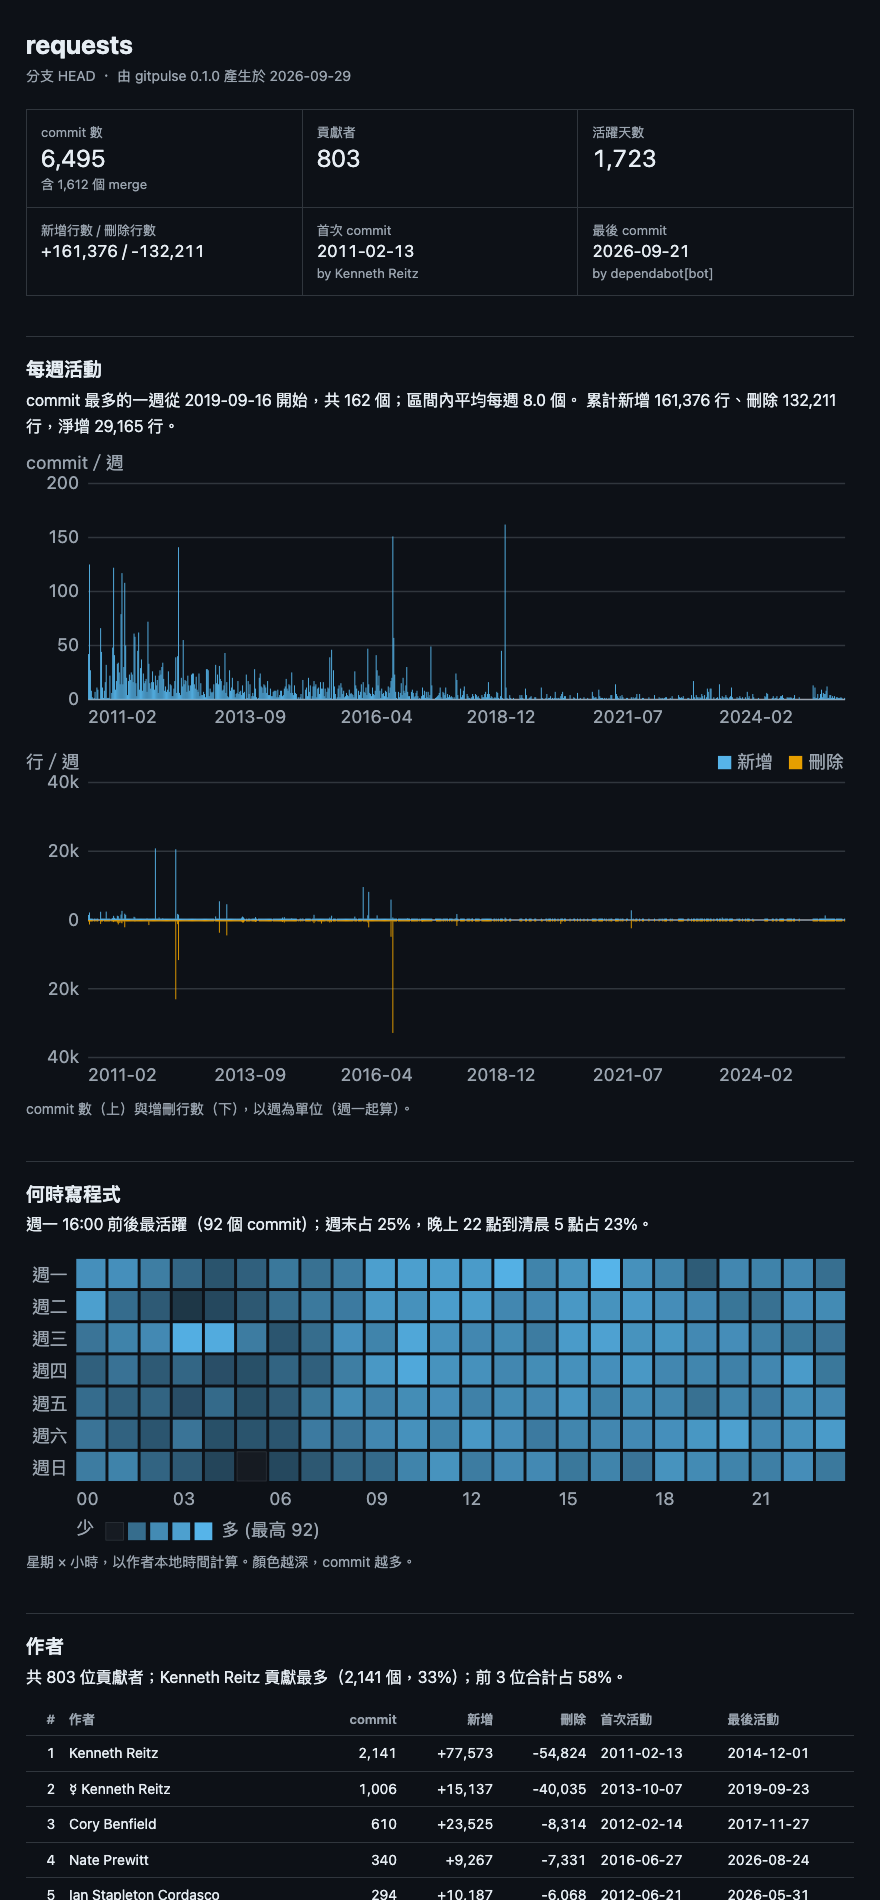
深色模式會跟著系統設定自動切換:
完整範例報告在 docs/example-report.html,下載後用瀏覽器打開即可。範例資料來自公開專案 psf/requests(Apache-2.0)的完整 git 歷史,僅作為示範。
功能
- 概覽:commit 數、貢獻者、活躍天數、增刪行數、首次/最後 commit
- 每週 commit 數,以及每週新增/刪除行數
- 星期 × 小時熱力圖(依作者本地時區)
- 作者排行:commit、增刪行、首次/最後活動;同一人的不同名稱或信箱用
.mailmap合併 - 檔案熱點:修改次數最多、改動行數最多的檔案;各頂層目錄的 churn
- 語言分布:依副檔名,統計目前版本的文字檔行數(二進位檔不計)
- Bus factor:每個頂層目錄要幾位作者才涵蓋 80% 的改動
- commit 訊息:平均標題長度、conventional commit 類型分布、最常見的開頭詞
- 每張圖都附一句自動產生的重點文字,數字有千分位,配色為色盲友善的藍/橘
- 支援淺色/深色模式、手機寬度不會水平捲動、可切換繁體中文或英文
- 能處理:檔名有空白或中文、重新命名(rename 會沿著歷史合併)、二進位檔、merge commit、空 repo、shallow clone
--json可輸出原始統計,方便自己再加工
安裝
需要 Python 3.10 以上與 git。打開終端機(Mac:「終端機」App;Windows:PowerShell):
先檢查版本:
python3 --version
git --version
方法一,用 pipx(推薦,不會弄髒系統的 Python):
pipx install git+https://github.com/useless-husband/gitpulse
方法二,用 uv:
uv tool install git+https://github.com/useless-husband/gitpulse
方法三,不安裝,直接下載後執行:
git clone https://github.com/useless-husband/gitpulse
cd gitpulse
python3 -m gitpulse --help
使用
在任何一個 git 專案的資料夾裡:
gitpulse -o report.html
然後用瀏覽器打開 report.html(Mac 可輸入 open report.html)。
也可以指定路徑與範圍:
# 分析別的資料夾,只看 2025 年,排除 vendor 目錄,輸出英文報告
gitpulse ~/code/my-project -o report.html --since 2025-01-01 --until 2025-12-31 \
  --exclude 'vendor/*' --lang en

# 只分析 main 分支
gitpulse . --branch main -o report.html

# 輸出原始統計(JSON)
gitpulse . --json > stats.json
| 參數 | 說明 |
|---|---|
repo |
專案路徑,預設為目前資料夾 |
-o, --output |
輸出檔,預設 report.html(搭配 --json 時預設印到標準輸出) |
--since, --until |
日期範圍,例如 2025-01-01;--until 含當天 |
--branch |
要分析的分支或 revision,預設 HEAD |
--exclude GLOB |
排除符合的路徑,可重複使用,例如 'vendor/*'、'*.lock' |
--lang zh\|en |
報告語言,預設 zh |
--json |
輸出 JSON |
-q, --quiet |
不印進度訊息 |
實際輸出範例
分析 psf/requests(6,495 個 commit):
$ gitpulse requests -o report.html
reading history of requests (HEAD)...
  2000 commits parsed
  4000 commits parsed
  6000 commits parsed
  6495 commits parsed
counting lines per language...
wrote report.html
進度訊息輸出到 stderr,所以 --json 的內容不會被污染。報告裡每個區塊上方都有一句重點,例如:
- 每週活動:「commit 最多的一週從 2019-09-16 開始,共 162 個;區間內平均每週 8.0 個。」
- 熱力圖:「週一 16:00 前後最活躍(92 個 commit);週末占 25%,晚上 22 點到清晨 5 點占 23%。」
- 語言:「Python 占 42.7%(12,032 行);共 13 種語言。」
--json 的部分輸出(以本專案的測試 repo 為例):
{
  "overview": { "commits": 6, "merges": 1, "authors": 2, "active_days": 5, "added": 27, "deleted": 0 },
  "bus_factor": { "overall": 2, "threshold": 0.8 }
}
專案結構
gitpulse/
├── gitpulse/
│   ├── cli.py        命令列參數與輸出
│   ├── collect.py    呼叫 git、串流解析、統計彙整
│   ├── langs.py      副檔名對應語言
│   ├── svg.py        SVG 圖表元件(刻度、比例尺、長條、熱力圖)
│   ├── report.py     組出完整 HTML(CSS、表格、少量原生 JS)
│   └── i18n.py       中/英文字串
├── tests/            unittest 測試(含用暫存 git repo 的整合測試)
├── docs/             截圖與範例報告
└── .github/workflows/ci.yml
跑測試
python3 -m unittest discover -s tests -v
測試會用 tempfile 建立暫存 git repo,並用固定的作者與 GIT_AUTHOR_DATE 寫腳本化 commit(含中文檔名、有空白的檔名、rename、二進位檔、merge、shallow clone、.mailmap),再驗證統計數字。SVG 產生器(刻度、座標)與 HTML 輸出(可被 html.parser 解析、沒有外部資源)也有測試。
原理簡介
- 執行一次
git log --numstat -z -M --format=...。欄位之間用0x1f、commit 之間用0x01分隔,檔名用 NUL 結尾(-z),所以檔名裡有空白、中文或引號都不會解析錯。 - 輸出以 1 MB 為單位串流讀取,每解析完一個 commit 就併入統計然後丟掉,不會把整段輸出存在記憶體裡,上萬個 commit 也只需要幾秒。
- git 是從新到舊輸出歷史,所以遇到 rename 時,記下「舊路徑 → 新路徑」,之後(較舊)的 commit 就自動算到新路徑上。
- 作者名稱由 git 依
.mailmap轉換。熱力圖的星期與小時直接取作者當時的本地時間。 - 語言行數用
git grep -I -c對目前版本計算(-I略過二進位檔)。 - Bus factor:把某目錄的改動行數依作者由多到少排序,累加到 80% 需要幾位作者。
- SVG 用字串組出來,顏色都寫成 CSS 變數,所以淺色/深色共用同一份圖;tooltip 與表格排序是幾十行原生 JS。
已知限制
- 統計的是「改動行數」不是「存活行數」,不做 blame。
- 語言分布只看目前版本;若使用
--exclude,也會套用到語言統計。 - merge commit 算入 commit 數與作者活動,但不計入增刪行數(git 預設不對 merge 產生 numstat)。
- 已知的縮寫或機器人帳號不會自動過濾。
授權
MIT © 2026 useless-husband